Floats
Overview
Teaching: 10 min
Exercises: 5 minQuestions
How to add images, figures ?
How to make things with the tabular environment ?
Objectives
Add figures and tables, with
Use the tabular environment
Add footnotes
Floats
LaTeX manages two kinds of floats, the figures and the tables, they are called floats because they can be inserted anywhere in the documents and referenced in the text (like Figure 1).
Figures and tables are managed the same way, they just have their distinct numbering.
Figures use the environment figure and tables the environment table.
A legend can be defined with the \caption{}command inside the float environment.
How to include external pictures
To include external picture files, you need to use the
\includegraphics{}command. The parameter contains the path to the picture (where the file is stored). The optional parameter can specify the figure size. For example,width=5cmwill fix the width of the picture and adjust the height accordingly.
04-figure-01
Tex file : 04-figure-01.tex
%<-----> ADDED to minimal <----->

  \begin{figure}
  \includegraphics[width=5cm]{fig/phd051608s}
  \caption{Where you sit in class/seminar. And what it says about you (from : http://phdcomics.com/comics/archive.php?comicid=1017)}
  \end{figure}
Compilation : 04-figure-01.pdf

Change the position of floats
By default if you don’t specify anything, LaTeX will move the float where it thinks it will be the best. You can specify where you want to have the float by adding option in the environment.
For example,
\begin{figure}[ht]means that you want the figure to be where you define it (withh: here) and a the top of the page (witht:top).The possible commands are :
b: bottom of the paget: top of the pageh: hereH: forced herep: create a page of floatsBy default (if you don’t put any indication), LaTeX uses
[tbp].
Tables
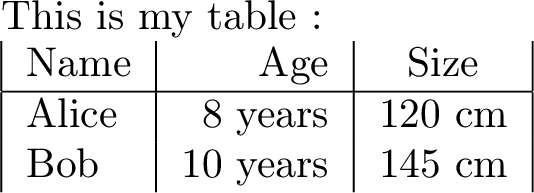
Tables are managed by the tabularenvironment. The 04-table-01.tex file below shows an example of a small table.
04-table-01
Tex file : 04-table-01.tex
\documentclass[a4paper]{article}

\usepackage[utf8]{inputenc}
\usepackage[T1]{fontenc}
\usepackage[english]{babel}
\usepackage{graphicx}

\begin{document}
This is my table :


\begin{tabular}{|l|r|c|}
   Name & Age & Size \\
   \hline
   Alice & 8 years & 120 cm \\
   Bob & 10 years & 145 cm \\
\end{tabular}

\end{document}
Compilation : 04-table-01.pdf

The parameter of the tabularenvironment : {|l|r|c|} represents the number of columns (here 3), the letter (l, c, or r) represents the alignment of each column (left, centered or right).
The vertical separator | will draw a vertical line.
Each line is ended by \\ and each row is separated by &.
To draw a horizontal line, you can use the \hlinecommand.
Exercises
Include graphics
I would like to add a picture that I have in my folder
imgand the filename ismypic.pngIn order to do that I need to write :
 \begin{float}
  \includegraphics{img/mypic}
 \end{float}
\begin{figure} \include{img/mypic} \end{figure}\begin{figure} \includegraphics{img/mypic} \end{figure}\begin{figure} \includegraphics{img\mypic} \end{figure}Solution
- The environment is not
floatbutfigure- The command is
\includegraphicsnot\include- Is correct : The image will be displayed in a
figurefloat- The path is wrong
Float position
I would like to all my float on the same page.
In order to do that I need to write :
\begin{figure}[p] The command for my figure \end{figure}\begin{figure}[t] The command for my figure \end{figure}\begin{tabular}[p] The command for my figure \end{tabular}>Solution
- Is correct : The floats will be on a specific page
- The float will be at the top of the page
- The environment for flaots is
figureortable
Empty cell
I would like to have an empty cell on the top left of my table. To do this, I need to use
\cline{}the displayed columns are specified using thestart-endformat, the first column is1in LaTeX. How could I code my table ?Solution
Possible solution :
\begin{tabular}{|l|c|c}
\cline{2-3} & Paris & Oslo \\
\hline
Rome & 1447 km & 2565 km \\
Prague & 1061 km & 1202 km \\
\end{tabular}
Key Points
Figure uses the environment
figureand table the environmenttableLegends are defined with
\caption{}inside the float environment.
\includegraphics{}is used to add external graphic file.By adding
[(h)(H)(p)(b)(t)]to the float environment, you can choose how LaTeXT put the float in the document.